
I’ve been struggling to figure out VO2max for awhile because I keep finding different charts and ranges of what’s “good” or “poor” or “excellent” and some charts have five categories and some have six, some divide ages based on decades and some on half-decades.
So, last night, I did some research. If you read this blog (looks like ~40 of you do? or at least follow it), then you know that I’m a scientist. I like numbers and data. But when the data disagree, and I don’t quite understand where they’re coming from or why, I have issues. As a scientist, I have some experience reading scientific papers that are usually very, very dense. I’m not a medical researcher, so it’s still outside my field, but I suspect I have a bit of an edge over the non-scientist.
In effect, there is no gold standard “correct” VO2max for someone, or authoritative work that suggests what your VO2max should be. Instead, what the researchers do is survey lots of people (some do 10,000s of people) and measure their fitness level and, among the many measurements, also measure VO2max. From those measurements, they can group people by gender and by age and then look at the distribution and say, “the lowest 25% of men aged 30–39 have a VO2max of 35.9.”
I found a few different studies that have done this:
- Graves et al. (2015) (link), who also made a page that gives you your percentile.
- Loe et al. (2013) (link)
- Kaminsky et al. (2015) (link)
There are many others, but those are the recent ones I found. Loe et al. studied almost 2000 men and 2000 women, while Kaminsky et al. studied 7783 men and women. Graves took data from a published study that’s in a book by the American College of Sports Medicine from 2014 (ref: American College of Sports Medicine. Health-related physical fitness testing and interpretation. In: Pescatello LS, Arena R, Riebe D, Thompson PD, eds. ACSM’s Guidelines for Exercise Testing and Prescription. 9th ed. Philadelphia, PA: Lippincott Williams & Wilkins; 2014:88-93.). The latter two who did their own studies list values as percentiles, as I noted above, like the 5th percentile, 10th, 25th, 50th, etc., for different age ranges. And, the Kaminsky et al. compares against data that Graves et al. used.
Just from looking at Table 3 of Kaminsky et al., there is significant variation between studies, by a couple points. So, for example, for my age range (men, 30–39), the 25th percentile from one study was 35.9, while the same percentile from the other is 37.8. For men aged 70–79, the 50th percentile is 24.4 vs 30.9. Women have similarly disparate results.
So, that’s one issue: Which study to use? Or, does it matter? One problem is that the two studies used very different methods to measure VO2max, one using the same kind of method that wearable devices like the Apple Watch use, and the other doing actual detailed measures of oxygen in and out of the body while doing strenuous exercise.
Still, I’m going with the latter answer, but I’m still using the Cooper Clinic / American College of Sports Medicine data, even though it generally requires a higher value for a given percentile, because the Graves et al. study actually has a nice formula. And it uses the same kind of prediction formulas that my watch uses. But the formula they give for figuring out your percentile means there are no large percentile bins so I don’t have to decide if I’m at the 10th or jump to the 25th. I can use the formula that they give to produce the graphs like the one above, and plot where I am.
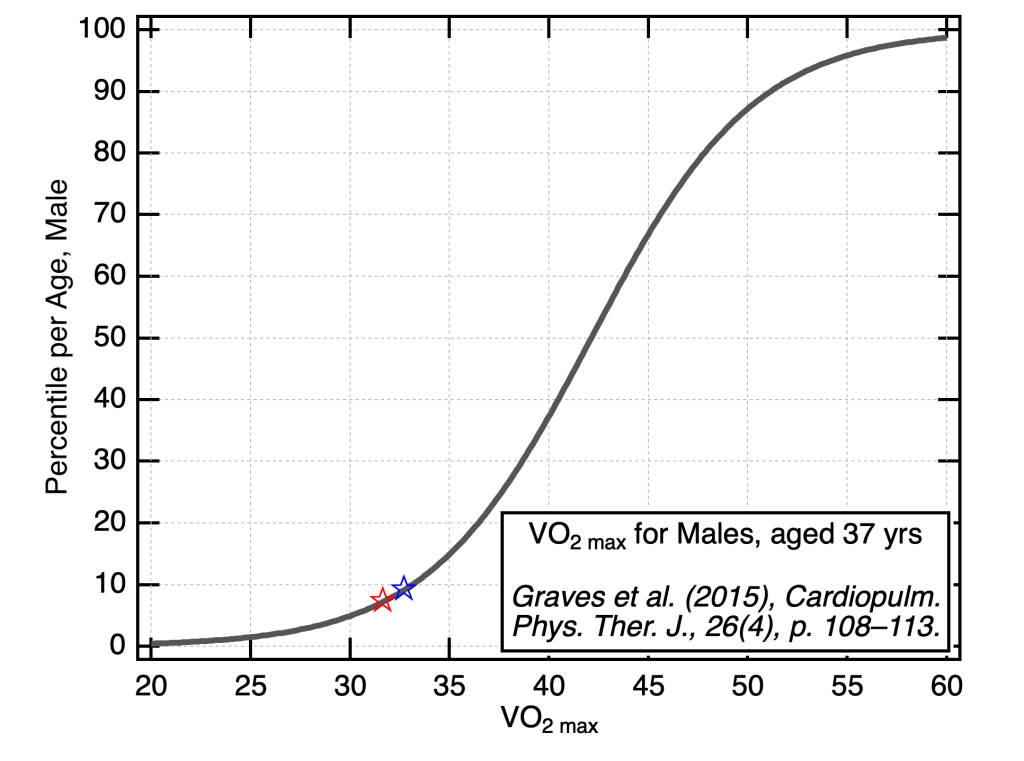
While keeping in mind that there’s some variation, so I should take things with a bit of salt, I made the graph at the top of this post. It uses the formula from Graves et al. (2015), based on the Cooper Clinic study of thousands of people, to give the percentile of the population of men who are 37 at a given VO2max. When I turn 38, I can re-do it using their formula.
So, now I can say that when I started back in February of this year (first few walks that have a VO2max for this year), I was around the 7th percentile. Meaning that 93% of men who are my age have a better VO2max than I do. This evening, I was at the 9th percentile.
So, my goal is no longer to be in some “good” or “excellent” range given by various charts or tables I’ve found in a Google image search. Instead, my goal is to at least reach the 50th percentile for men my age. That means I need to have a VO2max of at least 42. Surprisingly, both studies state that for the 50th percentile for men 30–39, I should have a VO2max of 42.4. The formula I’m using / chart I made is slightly lower since I’m 37, not 35. To be in the top 25th percentile (or, 75th percentile), I need to be >46.5.
And so … that’s that. And I feel more comfortable in understanding what my goal is and why my goal is what it is. It should also be easier to reach as I lose weight, since it’s measured in per kilogram of bodyweight, so if I weigh 20% less, my VO2max goes up quite a bit!
